Environmental footprint
Globally, at the current rate of consumption, 157% of the natural resources on the planet are being consumed. This means that an Earth and a half would be needed to maintain humanities environmental footprint. In order to preserve the world's remaining resources, it's crucial that everyone contributes to reducing our consumption.
Q-Park aims to have reduced its energy consumption in 2020 by 25% compared to the 2016 baseline, thus reducing our environmental footprint significantly. We manage our environmental impact by reducing energy consumption and by introducing energy-saving technology such as LED lighting with smart switching controls in our parking facilities.
Our lighting systems switch to brighter lighting when movement of cars or pedestrians is detected. In addition, when no cars are present in part of the car park, lighting is automatically dimmed to emergency levels.
We also take simple operational measures to increase the efficiency of our parking facilities. For example, in quiet periods, we temporarily close off parking decks until the number of available spaces on the decks in use reach a certain minimum. We can do this simply by placing traffic cones in the entrance.
We report greenhouse gas (GHG) emissions according to the GHG Protocol. This means we report on scope 1, 2 and 3.
Emissions
Q-Park wants to contribute to lowering CO2 emissions as this contributes to the general quality of life, and that in urban areas in particular.
Results
In 2019 we reduced our carbon footprint per parking space in owned and long-leased parking facilities by 12% compared to 2018. This further reduction can be attributed to our LED programme and operational measures designed to increase overall efficiency.
Chart 14 CO2 emissions (tonnes) per type of structure
Chart 15 CO2 emissions (kg) per parking space per type of structure
Chart 16 Total greenhouse gas emissions (GHG) in tons CO2
Our car fleet
Our car fleet is slowly changing as we replace diesel cars at the end of their useful life span.
Results
In 2019 we shed another 8 diesel cars as their lease contracts expired and added 2 all electric vehicles to our fleet bringing the total to 55 e-cars.
Chart 17 Car fleet
Energy efficiency
Q-Park is a large consumer of electricity, both for lighting and operational equipment, as well as for charging electric cars. We have an energy-saving programme in place to implement measures for reducing energy consumption.
The Q-Park energy-saving programme is demonstrating clear benefits – in financial terms as well as in our environmental impact. We procure our energy on a larger scale by means of a central purchasing policy and have operational action plans to consume fewer kWh ourselves.
Furthermore, towards the end of 2019, renovation of the Veerkaden parking facility in the Netherlands was complete. This is the first 100% energy-neutral car park. The transformation means that the parking facility is sustainable and future-proof for all its energy needs.
More about the 100% energy-neutral car park.
Results
In 2019 the total amount of energy, measured in GWh, that we consumed in our owned and long-leased parking facilities (OLL PFs) decreased by 2%.
Chart 14 Total GWh consumed by OLL PFs
LED transformation
In 2019 Q-Park completed its LED transformation project to accelerate the transformation to energy-efficient LED lighting in selected parking facilities. It's thought to be the largest project of its kind in Europe.
We required durable, consistent quality lighting with a long warranty of at least 10 years on every lighting product we use and we've specified differing lighting levels for different purposes in the various areas within a parking facility to meet or exceed statutory requirements as follows:
85 lux - parking spaces, driving aisles
100 lux - staircases, lift lobbies, toilets
200 lux - parking equipment areas
300 lux - payment areas
75 lux (night time) and 300 lux (day time) - transition light at car access and exit areas to allow motorists time to adjust their eyes to differences in light levels
Kelvin light colour temperature - 4,000K
Measurable reductions - example
Berlin-Alexanderplatz
Re-engineering installed in June 2019
Average reduction in kWh consumption 42%
Average reduction in EUR costs to date 53%
Carbon footprint reduction 25%
Our measurable results clearly show that investing in energy-saving lighting solutions makes sense. Not just for shareholders but all stakeholders, including the societies in which we operate.
More measurable reduction examples.
Phase II
We have identified a further 93 parking facilities for our LED transformation Phase II to be analysed. The final list for implementation by year end 2020 will be based on underlying business cases. We realise that these sites will have a longer pay-back time but the potential savings are still interesting enough for us to invest even more in LED lighting.
Figure 18 LED example kWh reduction
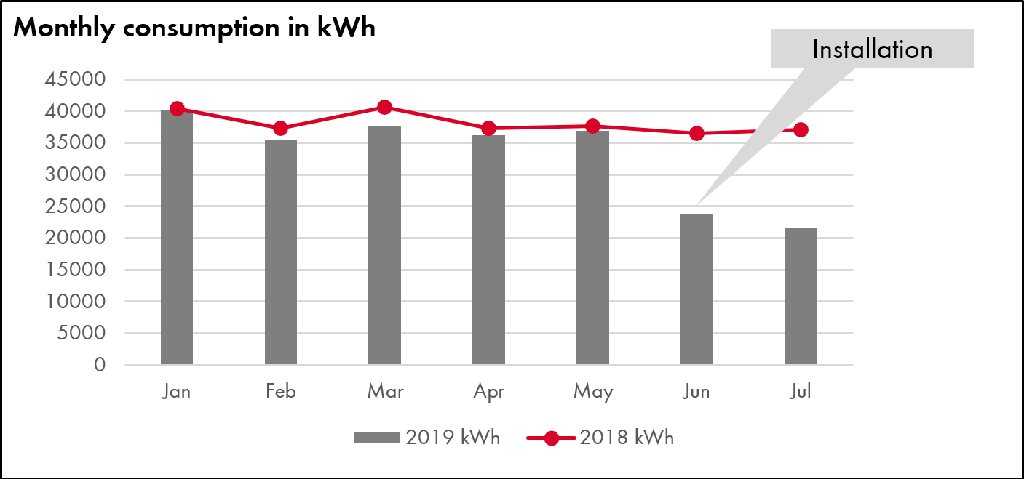
Figure 19 LED example cost reduction
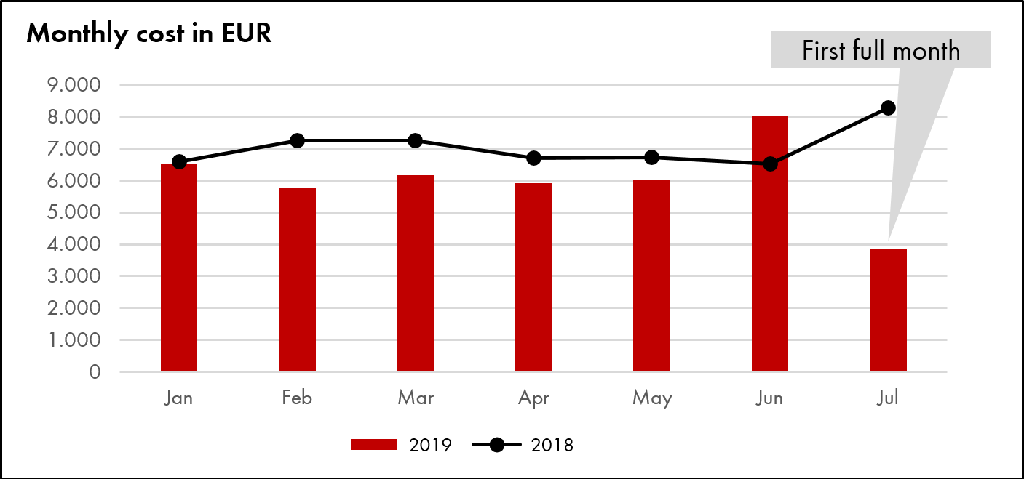
Figure 20 LED example before redesign
Figure 21 LED example after redesign
Results
At the close of 2019, another 169 of our parking facilities were fitted with energy-saving LED lighting (2018 and 2017 combined: 59). In the seven countries in which we operate, we have fitted more than 300 of our parking facilities with energy-saving lighting solutions, of which 228 with LED lighting.
We've done a thorough analysis on the 169 LED installations in 2019, comparing the difference between the 2018 pre-installation kWh data and the 2019 post-installation kWh data. Overall, we have achieved a 35% saving on electricity consumption.
From 2020 onwards, we expect to save at least 15 GWh per year, that is more than 4,241 tons of CO2 emissions - just from having installed LED lighting.
Table 1 kWh & CO2 savings
Download data
Country | PFs | Actual % kWh reduction | Monthly kWh savings | Emission factor (kg CO2e/kWh) | Monthly CO2 savings (in kg) |
NL | 51 | 34% | 541,464 | 0.399 | 216,017 |
DE | 19 | 25% | 72,384 | 0.472 | 34,152 |
BE | 17 | 43% | 135,169 | 0.189 | 25,602 |
UK | 27 | 23% | 105,560 | 0.256 | 26,981 |
FR | 38 | 42% | 341,314 | 0.059 | 20,015 |
IE | 6 | 39% | 30,896 | 0.419 | 12,953 |
DK | 11 | 31% | 60,589 | 0.293 | 17,755 |
Total | 169 | 35% | 1,287,377 | 353,476 |
LED - Proven energy efficiency.
Click here for our LED Showcase.